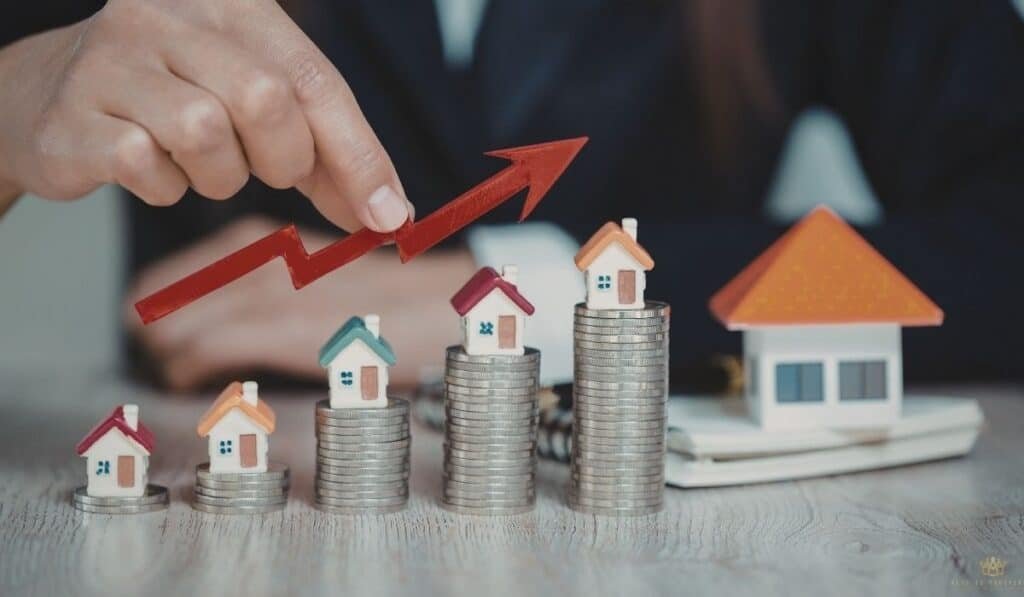
We’ve watched countless families buy their first home, upgrade to something bigger, or invest in rental properties. One question always comes up early in the conversation: what does this property do for us over time?
As of mid-2026, the national housing market shows stable signs of growth. Prices have settled into a steady 2.0% year-over-year climb, with the median sale price across the country landing at $398,771.
These numbers tell us the market is cooling after the wild ride of recent years. That cooling is actually a good thing. It points to a healthier cycle where we can rely on historical patterns again.
From our experience, the people who succeed in real estate are the ones who start with a clear understanding and appreciation before they ever sign a contract. They look at home prices not as a guessing game but as a long-term picture.
This guide is for homeowners wondering what their property is doing, buyers trying to time their purchase, and investors building portfolios. We want to help you see the data clearly and make decisions that serve your financial future.
We recently covered the average real estate ROI in another piece, and we’ll touch on what makes property value increase in our next article. These are all pieces of the same puzzle.
Think of this as your practical starting point for the bigger picture of investing facts that shape wealth-building decisions. Our goal here is straightforward.
We want to answer a simple but powerful question: what’s the average home appreciation per year, and how do you make that number work for your own financial goals?
Short Summary
- The average home appreciation per year historically lands between 3 and 5 percent nationally, though 2026 shows steadier 2 percent growth.
- Location, supply and demand, and the land beneath your home drive home appreciation more than national averages.
- Routine maintenance and smart upgrades protect your property value while interest rates shape buyer power.
- Land tends to gain value steadily as a finite asset, even as structures age.
- Real estate rewards patient, informed decisions focused on long-term growth.
What Is the Average Home Appreciation Per Year, And What History Tells Us
National averages give us a solid starting point. The average home appreciation per year sits between 3 and 5 percent over long periods. That range holds up across decades of data.
Right now in 2026, we see stabilization around 2 percent year-over-year growth. This feels closer to normal patterns after the wild swings of recent years.
We track these trends closely at Keys To Prosperity. A home bought for $300,000 at a steady 3 percent compound annual growth rate gains roughly 16 percent in total equity after five years. That adds meaningful value.
Such growth often matches or beats inflation. (It turns home appreciation into real wealth over time.)

How Appreciation Compares to Inflation Over Time
Real estate stands out as a long-term investment. It protects purchasing power better than cash in most cycles. For instance, homes have delivered steady gains even when inflation climbed. This edge helps families build equity instead of watching savings lose ground to rising costs.
Reading Market Cycles: From the 2020 Boom to 2026 Stabilization
Markets move in waves. The 2020 to 2023 period brought rapid price jumps from low rates and high demand. But we got to remember, those years were an outlier, not the standard. Today we see calmer market conditions.
Stabilization forms part of healthy market cycles. Warren Buffett once noted that patience rewards those who understand these rhythms. We advise families to zoom out. Short-term dips rarely erase the upward path of value over time.
Why Location Drives Home Value More Than Any National Average
National figures hide big differences between areas. One zip code can surge while another stays flat. Home value depends far more on local realities than any broad national average.
Take the contrast playing out in 2026. Midwest and Northeast markets show stronger gains thanks to tight supply. Sun Belt spots cool off after big building booms. We see this pattern repeat. Location shapes outcomes more than almost any other factor.
Supply, Demand, and the Inventory Crunch Reshaping Local Prices
Basic economics rules local prices. Low supply plus steady demand pushes values higher. Consider this example: Midwest cities with limited new construction keep inventory tight. That supports steady price growth.
Sun Belt markets added thousands of units. The extra supply eases pressure and slows appreciation rates there.
Watch your own city and track active listings. Fewer homes for sale usually signals rising property value.

What Makes a Neighborhood Push Property Values Higher
Several forces lift home value together:
- Strong job growth draws more people and raises demand.
- New roads or schools boost appeal fast.
- Steady population growth compounds gains year after year.
Single-family homes often hold value best among property types. They offer space families want. Focus on neighborhoods adding jobs and infrastructure. Those spots deliver the strongest long-term results.
We Guide People How To Invest In Real Estate
The Physical Variables: Square Footage, Condition, and Smart Upgrades
Your home is more than land and location. Its physical traits affect current value and future resale. Smart choices here give you real control.
How Appraisers Calculate Your Current Value
Appraisers look at hard numbers during home buying. They measure square footage and livable space. Then they compare your place to recent sales nearby. A well-kept three-bedroom home in a good area usually beats a similar but neglected one down the street.
Local comps tell the real story. Check recent sales yourself on public sites before you list.
Maintenance and Upgrades That Protect Your Investment
Routine care matters a lot. Those neglected roofs or outdated systems? They can drag values down fast.
Maintenance stops small problems from becoming expensive ones. It proves extremely important for long-term value.
Before a sale, certain home improvements stand out. Kitchen and bath updates often return solid money. Focus on repairs that buyers notice first. Homeowners and investors who stay on top of these details protect their investment best.
(These steps feel basic, yet many skip them until it is too late.)
How Much Does Land Appreciate Per Year — And Why It Matters
A common question we hear from new investors is this: how much does land appreciate per year? The answer runs deeper than most expect. Land behaves differently from the house built on top of it.
Structures lose value over decades. Roofs wear down and systems need replacement. Yet the land stays finite. And finite resources often hold or grow in worth.
Farmland gives us a useful benchmark. U.S. farm real estate averaged $4,350 per acre in 2025. That marked a 4.3 percent rise from the year before. Cropland specifically reached $5,830 per acre with a 4.7 percent gain.
Residential land follows similar scarcity principles but ties closely to housing demand.
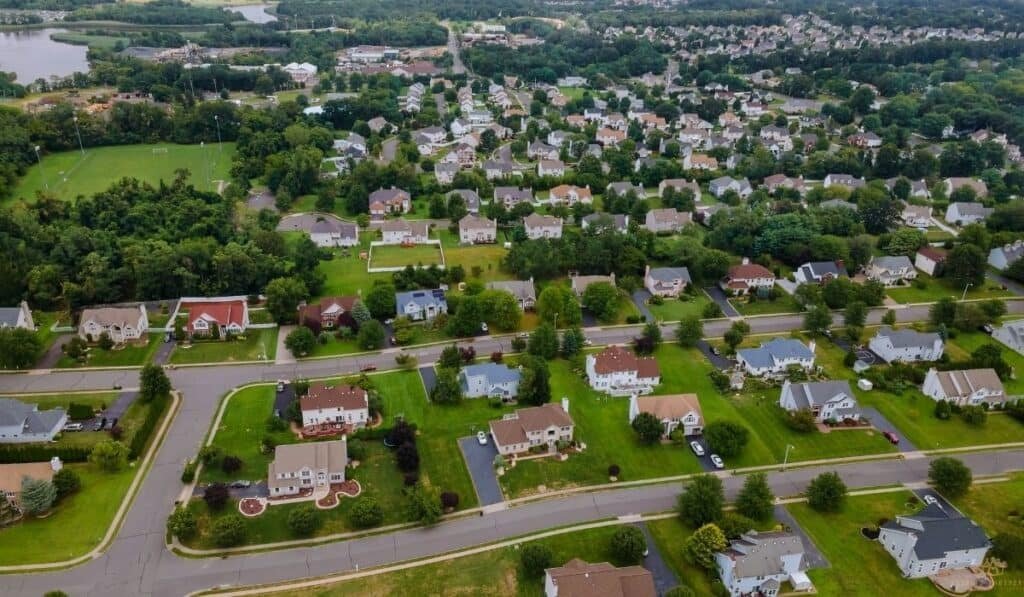
Scarcity, zoning shifts, and nearby commercial growth drive much of this. In growing metro areas, land now makes up about 38 percent of a home’s total property value. That portion climbs as buildable lots grow scarce.
Even as your house ages, the ground beneath it can keep gaining. This dynamic explains why strong locations boost appreciation long-term. You buy more than walls and a roof. You secure a spot in a specific place.
We’ve watched transit lines or new developments spark quick jumps in land worth. Pay close attention to the land when you evaluate any purchase. The house you can update, but the land? You can’t replace that.
Interest Rates, Mortgage Costs, and What They Mean for Appreciation
Talk of home appreciation always circles back to borrowing costs. Interest rates and mortgage rates shape what buyers can afford. Affordability decides who enters the market. Low rates bring more competition and lift prices. High rates do the reverse.
As of mid-June 2026, the 30-year fixed rate sits near 6.5 percent. That is down slightly from 2025 averages but well above pre-2022 levels.
A buyer comfortable with a $400,000 home at 3 percent might only qualify for around $300,000 at 7 percent. Fewer active buyers ease pressure on appreciation. Yet rates don’t act alone. A modest drop can turn renters into buyers. That extra demand supports prices.
Analysts see possible movement toward 5.75 percent later in 2026. Even small savings matter. On a $1 million loan, shaving from 6.2 percent to 5.5 percent cuts the monthly payment by hundreds of dollars.
Closing costs add another layer of friction. Those upfront fees reduce what you can put toward the actual purchase.
The lock-in effect keeps things interesting too. Many homeowners hold low-rate mortgages from earlier years. They hesitate to sell and reset higher. This keeps supply tight and props up values.

The path to equity may take longer today. But the underlying forces still favor growth over time. We focus on the long view. Steady progress beats perfect timing every time. (Markets rarely hand us ideal conditions anyway.)
Final Thoughts
Home values generally rise over the long haul. Temporary stalls happen, sure. Yet the overall direction points upward. This steady growth supports your financial goals and builds real future value.
We believe education forms the foundation of lasting wealth. Treat homeownership as a smart long-term investment. Make decisions based on solid data instead of guesses.
Come join the Keys To Prosperity community. Build your financial literacy with us. Head over to our homepage at thekeys2prosperity.com and take the next step toward greater freedom.