Based on recent data from the Census Bureau, we’re looking at roughly 146 to 150 million housing units across the country. That number grows each year as new home construction adds to the total supply.
From our experience tracking the housing market, this figure represents more than just a statistic. It’s the foundation of communities where residents live, work, and raise families.
So how many homes are in the US right now? This article answers that question by exploring the data behind total housing units, home construction trends, and what these numbers mean for residents across the country.
We’ll break down the economic factors that shape building patterns and explain why demand keeps rising despite challenges like mortgage rates and inflation.
For everyday readers, understanding housing supply helps make sense of housing costs and affordability. For real estate investors, the numbers tell a different story. In our previous article on real estate investing risks, we covered the challenges investors face in this market.
Now we’re following up with a closer look at how many homes are owned by investors as part of our broader series on real estate investors. These connected pieces help paint the full picture of who lives where and why.
Short Summary
- Total housing units in the US: Approximately 147 to 150 million, based on Census Bureau estimates.
- Single family homes: Roughly 82 million units, making up about 56 percent of all housing .
- Annual new home construction: Builders completed around 1.4 million units in 2025, with single-family starts projected at 1.05 million for 2026 .
- Housing shortage: The supply gap currently sits at roughly 4 million homes, up from 3.8 million in 2024.
The Current Landscape: Understanding Total Housing Units
To really understand the size of the American housing market, it helps to first look at how we define and count our homes. Reliable census estimates reveal how different types of homes shape the total housing units across the units in the united housing supply.

What Counts as a Housing Unit?
The Census Bureau defines housing units as any structure or space where people live separately. A unit must provide a place for occupants to sleep, cook, and live without sharing those spaces with another household.
Common structure type categories include the following:
- Single family houses built on their own lot
- Apartments located in multi-unit buildings
- Manufactured homes in planned communities
- Other small residential structure formats like duplexes
Each category contributes to the total housing units across the units in the united housing inventory.
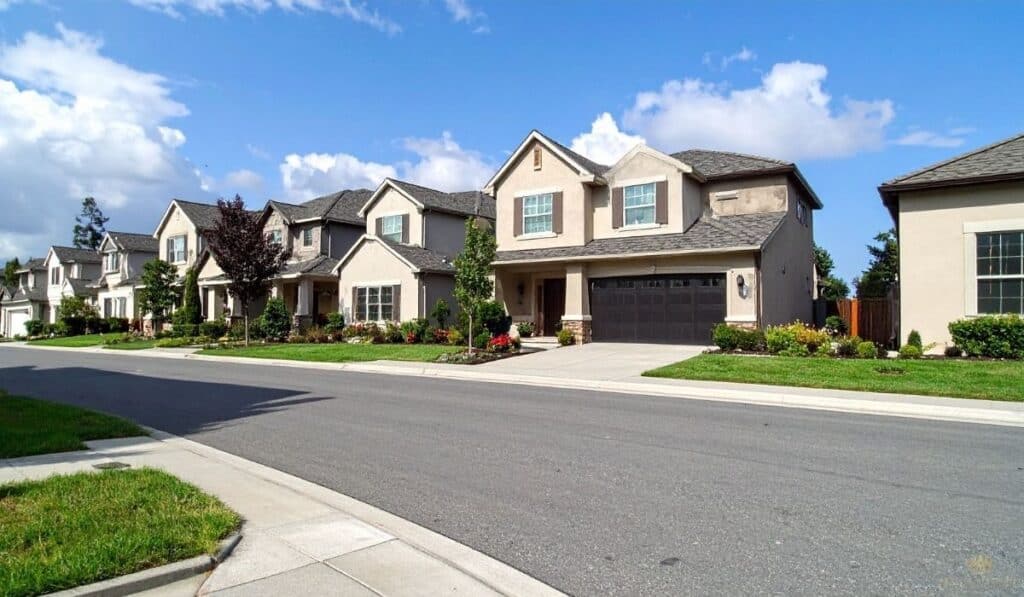
Consider a quick example. A single suburban street with twenty single family houses counts as twenty units. A downtown building with twenty apartments counts as twenty housing units as well.
Housing analysts often remind readers of this principle. Urban economist Edward Glaeser once noted that counting units, not buildings, offers the clearest view of housing supply.
We Guide People How To Invest In Real Estate
Occupied vs Vacant Housing Units
The census separates homes into occupied and vacant housing units. These categories help researchers understand how homes serve households and communities.
Common classifications include:
- Owner-occupied homes where households live in property they own
- Rental units where residents pay rent to a landlord
- Vacant units temporarily without occupants
Many vacant housing units still serve a purpose. A coastal condo might sit empty during winter as an investment property. Another unit might wait between tenants for repairs.
These distinctions shape the total housing units calculation. Every home counts toward supply, even if nobody lives there today.
Housing Supply and the Ongoing Housing Shortage
A key issue facing the housing system involves the ongoing housing shortage. The population continues to grow faster than construction adds new homes.
Limited supply pushes housing costs higher. Rising home prices reduce housing affordability for many residents and first-time buyers.
For example, families in fast-growing cities often compete for the same limited homes. Rural communities experience similar pressure when construction slows.
Housing economist Lawrence Yun once explained the issue clearly. “Housing supply remains historically low relative to demand.”
The takeaway remains simple. More housing units must enter the market to balance demand and stabilize prices.

How Many Single-Family Homes in the US?
The American housing system leans heavily on one structure type. Single family homes make up the majority of residences in the country, shaping neighborhoods, suburbs, and small towns.
Why Single Family Homes Dominate the Market
Many buyers prefer single family houses for everyday living. The design offers privacy, yard space, and larger square foot layouts.
Typical reasons buyers choose this single family structure include:
- Private living space for growing families
- Larger square foot layouts compared with apartments
- Suburban development patterns that favor detached homes
Demand remains strong even when home prices increase. Buyers often accept higher housing costs to gain stability and space.
Here’s a typical suburban street: Several single-family homes sit side by side, each owned by separate residents. Surprisingly (or maybe not surprisingly), that pattern still dominates American neighborhoods.
Housing analysts often describe this demand as cultural. As one housing planner joked during a conference, “Americans love their backyard.” True.
Homeownership Rates Across the Country
The national homeownership rate typically sits near the mid-sixty percent range. Millions of homeowners hold property across the United States.
Ownership patterns vary among racial groups and income levels. Data shows lower homeownership among black Americans and several historically underserved communities.
Researchers often point to factors such as:
- Differences in income levels
- Access to credit
- Regional housing costs
Some demographic groups see rising ownership trends. Certain pacific islander populations and immigrant communities have increased homeownership rate growth in recent years.
Housing advocates often stress fairness in access. Former HUD Secretary Ben Carson once noted that “homeownership creates stronger communities.”
Policies That Shape Single-Family Housing
Government policy strongly influences the number of single-family houses built each year. Local rules shape where homes can appear and how neighborhoods grow.
Common regulations affecting housing include:
- Zoning limits on development density
- Mandatory parking requirements for new homes
- Building guidelines from the Department of Housing and Urban Development
Local planning boards often determine whether new neighborhoods appear. One zoning meeting can delay dozens of new single-family homes.
That matters because supply affects price. Limited construction pushes the median sale price higher in many regions.
In short, policy decisions play a major role in shaping the American housing landscape.
How Many Homes Are Built in the US Each Year?
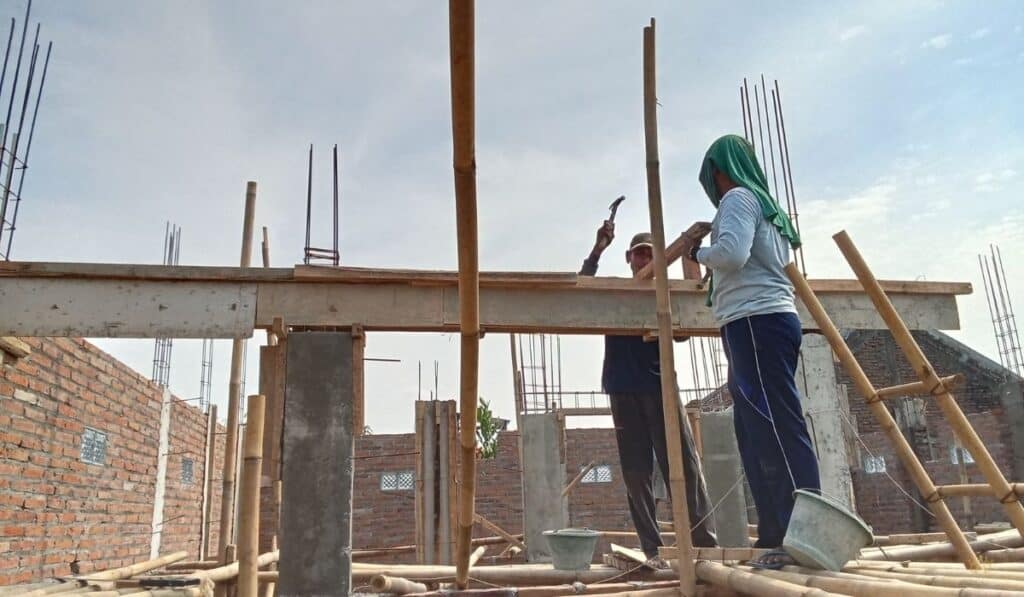
New home construction plays a critical role in meeting housing needs across the country. Builders added roughly 1.4 million new homes in 2025, though that number fluctuates based on economic conditions.
Staying on top of these trends is the best way for residents and investors to navigate the market wisely.
Trends in New Home Construction
Home construction serves as the primary mechanism for expanding housing supply. Without steady building, the gap between available units and growing population would widen even faster.
The latest data shows housing starts hit a seasonally adjusted annual rate of 1.48 million in January 2026. That represents a solid pace despite headwinds.
Recent years show an interesting pattern. Construction activity peaked in 2021 then slowed as mortgage rates climbed. But builders adapt.
Take single family builders in Texas, for example. They shifted toward smaller floor plans to keep new homes affordable when rates jumped. Development strategies change with market conditions.
Average annual construction numbers hover around 1.4 to 1.5 million units in recent years. That sounds impressive until you consider households form at roughly the same pace. The math barely keeps up.
Builders respond to demand signals from population growth and job creation, concentrating new home construction in fast-growing Sun Belt cities.
Mortgage Rates, Inflation, and the Housing Market
The connection between borrowing costs and home construction runs deep. When mortgage rates drop, more buyers qualify for loans. That sparks demand for new homes. When rates rise, builders pull back. Simple as that.
Mortgage rates hit 6.09% in February 2026, the lowest level since September 2022. This shift matters enormously for the housing market.
A buyer with a $400,000 loan saves nearly $400 monthly compared to the 7.5% rates we saw in 2023. Those savings translate directly into more purchasing power.
Inflation complicates the picture. Persistent price increases forced the Federal Reserve to raise rates aggressively. That slowed construction because builders face higher financing costs for land acquisition and development.
The economy sends mixed signals, but lower mortgage rates in early 2026 offer hope for a stronger spring selling season.
Bell Bank economists project 30-year mortgage rates will average between 6.0 and 6.4 percent through 2026. That range supports steady building activity without overheating demand.
Housing Access and Social Challenges
Behind the statistics lie real people struggling to find homes. Housing numbers tell only part of the story. The human toll shows up in homelessness counts and families doubling up.
Persons experiencing homelessness reached a record 771,480 in the 2024 point-in-time count. That number represents a sharp increase driven largely by unaffordable rents.
Balakrishnan Rajagopal, the UN special rapporteur on the right to housing, put it simply: People cannot afford the rents. That reality drives the crisis.
Residents in expensive cities face impossible choices. A family might spend half their income on housing, leaving nothing for savings or emergencies. One late paycheck pushes them toward eviction.

Building more homes won’t solve everything, but it’s essential. The Urban Institute notes that homelessness is primarily driven by unaffordable housing.
Increasing supply helps stabilize housing costs over time. Communities that implement housing-based solutions see fewer people experiencing homelessness and faster exits from homelessness when it occurs.
For real estate investors, this creates both responsibility and opportunity. Thoughtful development that includes affordable components serves communities while generating returns. The challenge lies in balancing both goals.
Final Thoughts
The United States now holds close to 149 million housing units. That huge total number shows the real size of our housing system. Figuring out how many houses exist gives us useful clues.
It reveals a lot about housing supply, homeownership trends, and housing costs and affordability. These pieces of data matter more than many people think.
They help us understand our economy, support stronger communities, and keep the American dream within reach for homeowners. Curious to learn more? Head over to our homepage for additional guides on the housing market.